

Share This

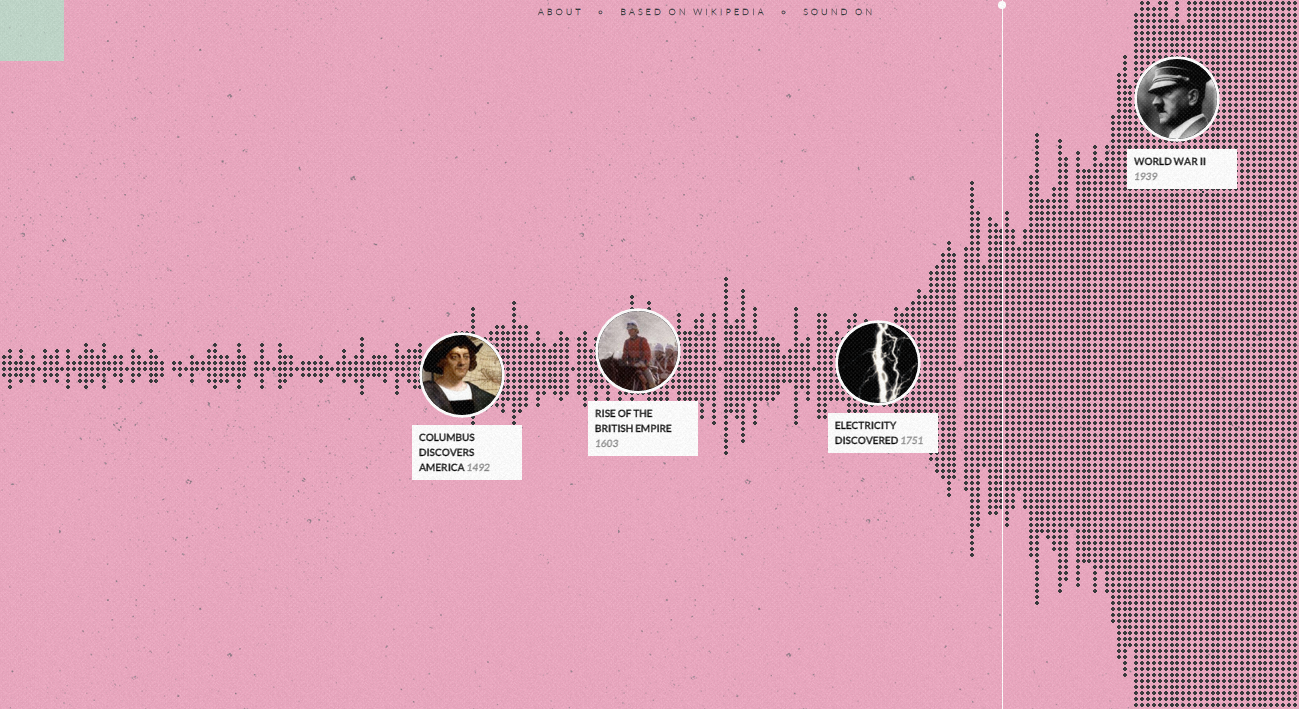
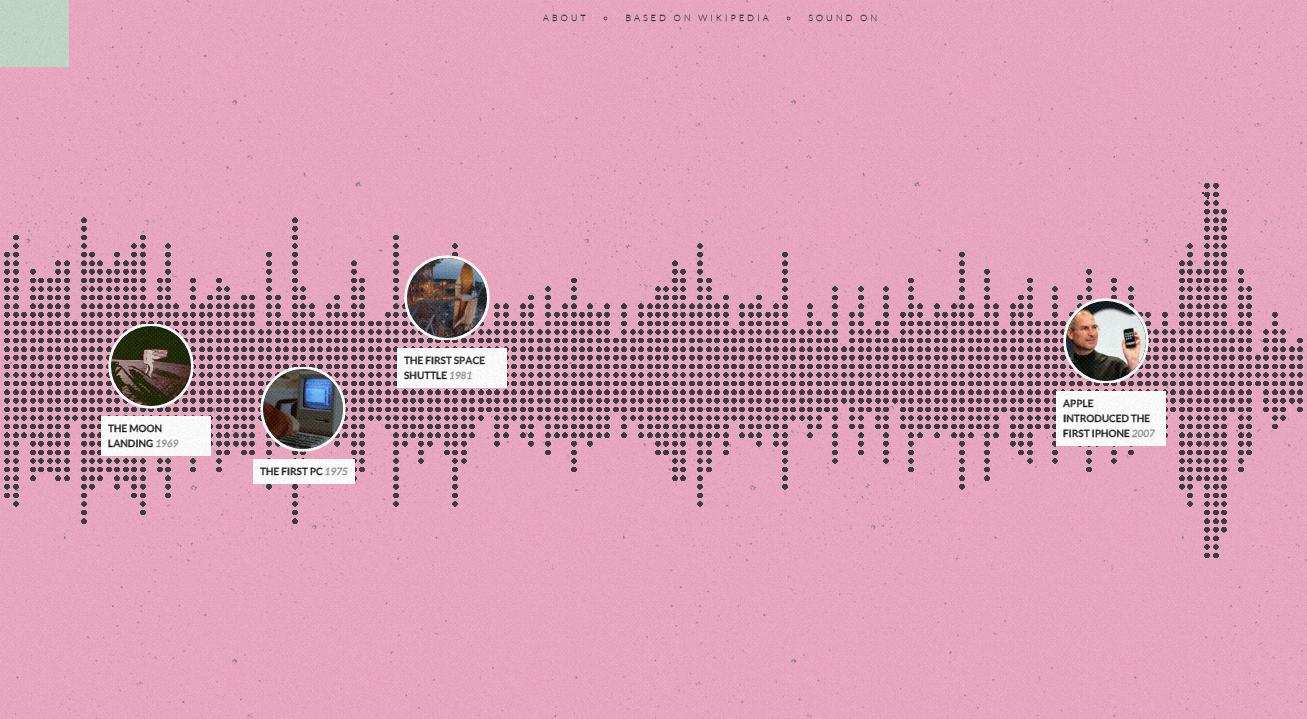
Imagine a significant moment in history as a single dot. Now, imagine every significant moment in history since the Big Bang as a single dot. Sounds chaotic, doesn’t it? Well, Israeli designer Matan Stauber has created an interactive timeline spanning across 14 billion years, pulling every historical event from Wikipedia and visualising each as a small grey dot. And there’s nothing remotely chaotic about it.
Combining pointillism with the art of sound waves, Histography is an exciting voyage through time that anybody would find quick and easy to navigate. A remarkable example of data visualisation done right.


Leave a Reply